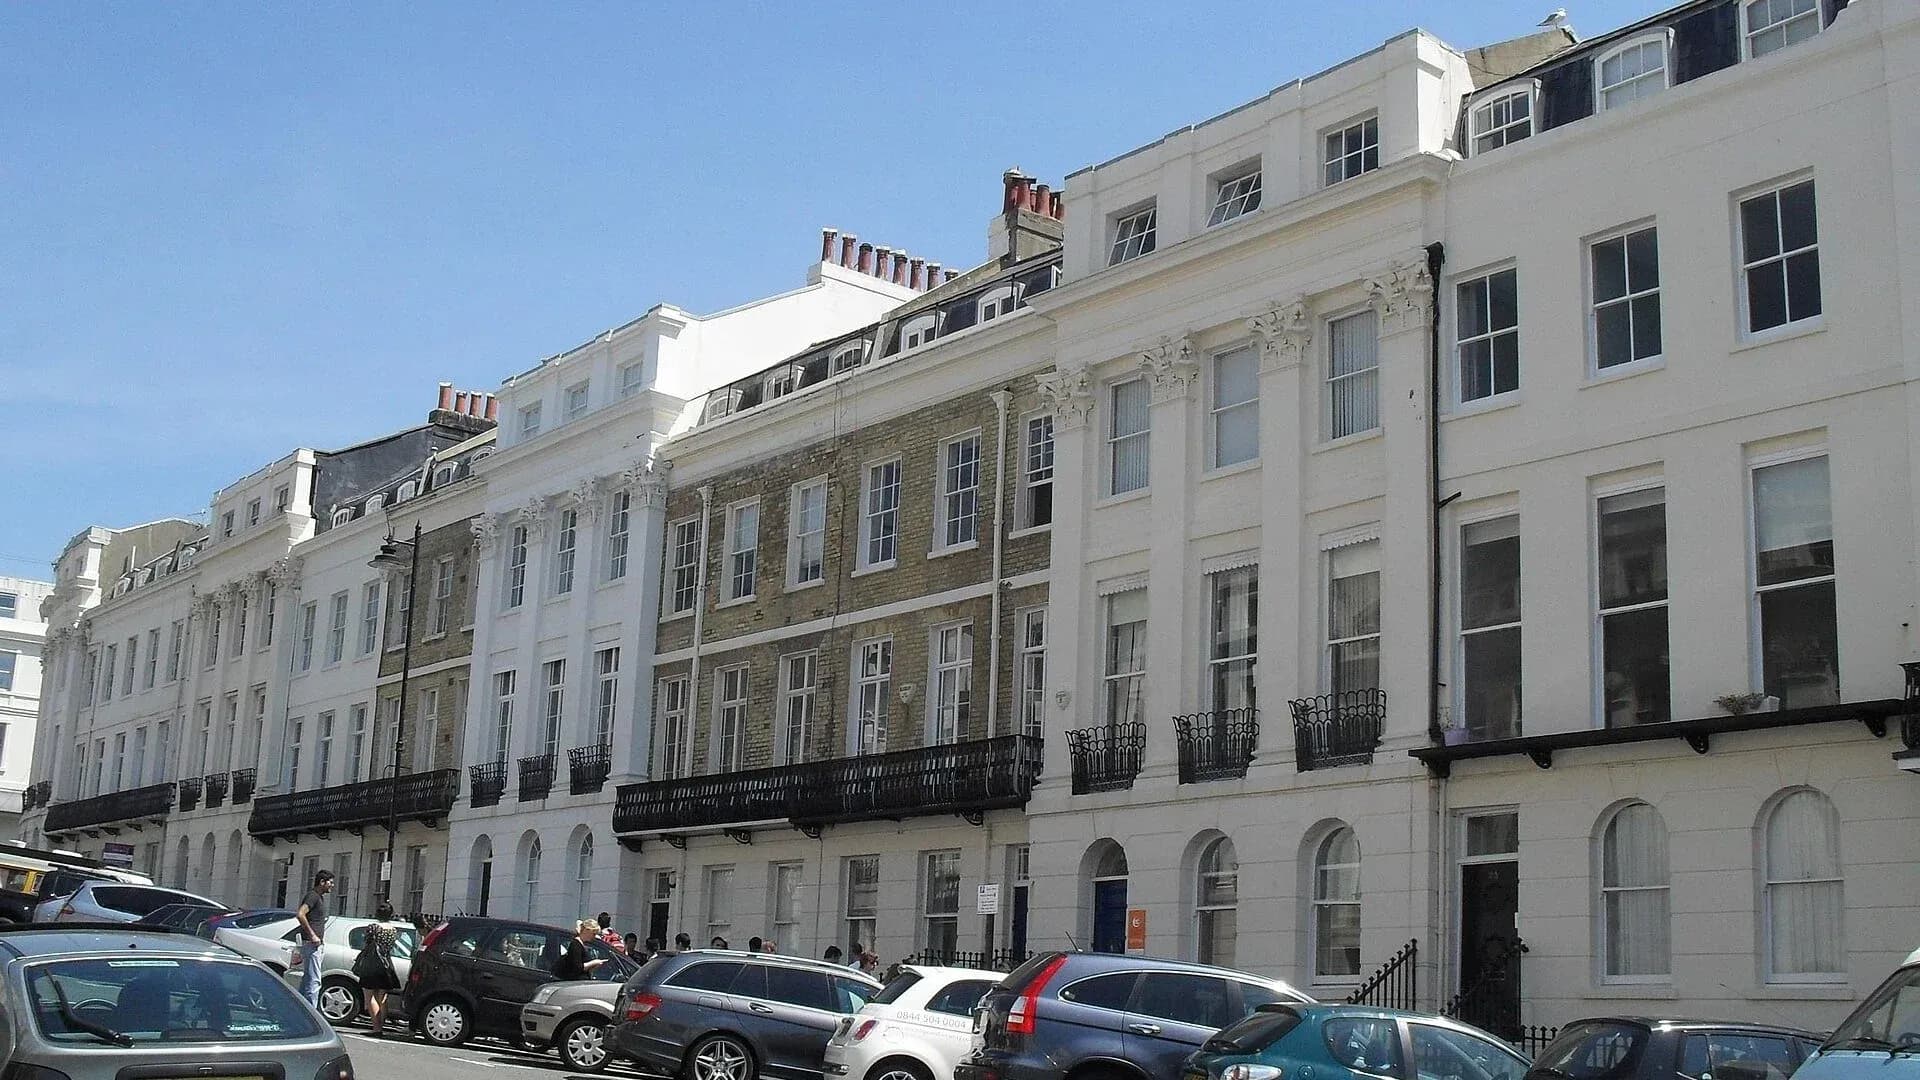
Private rents in Brighton and Hove fell over the year to September 2026 while they rose across most of the country, new figures from the Office for National Statistics show.
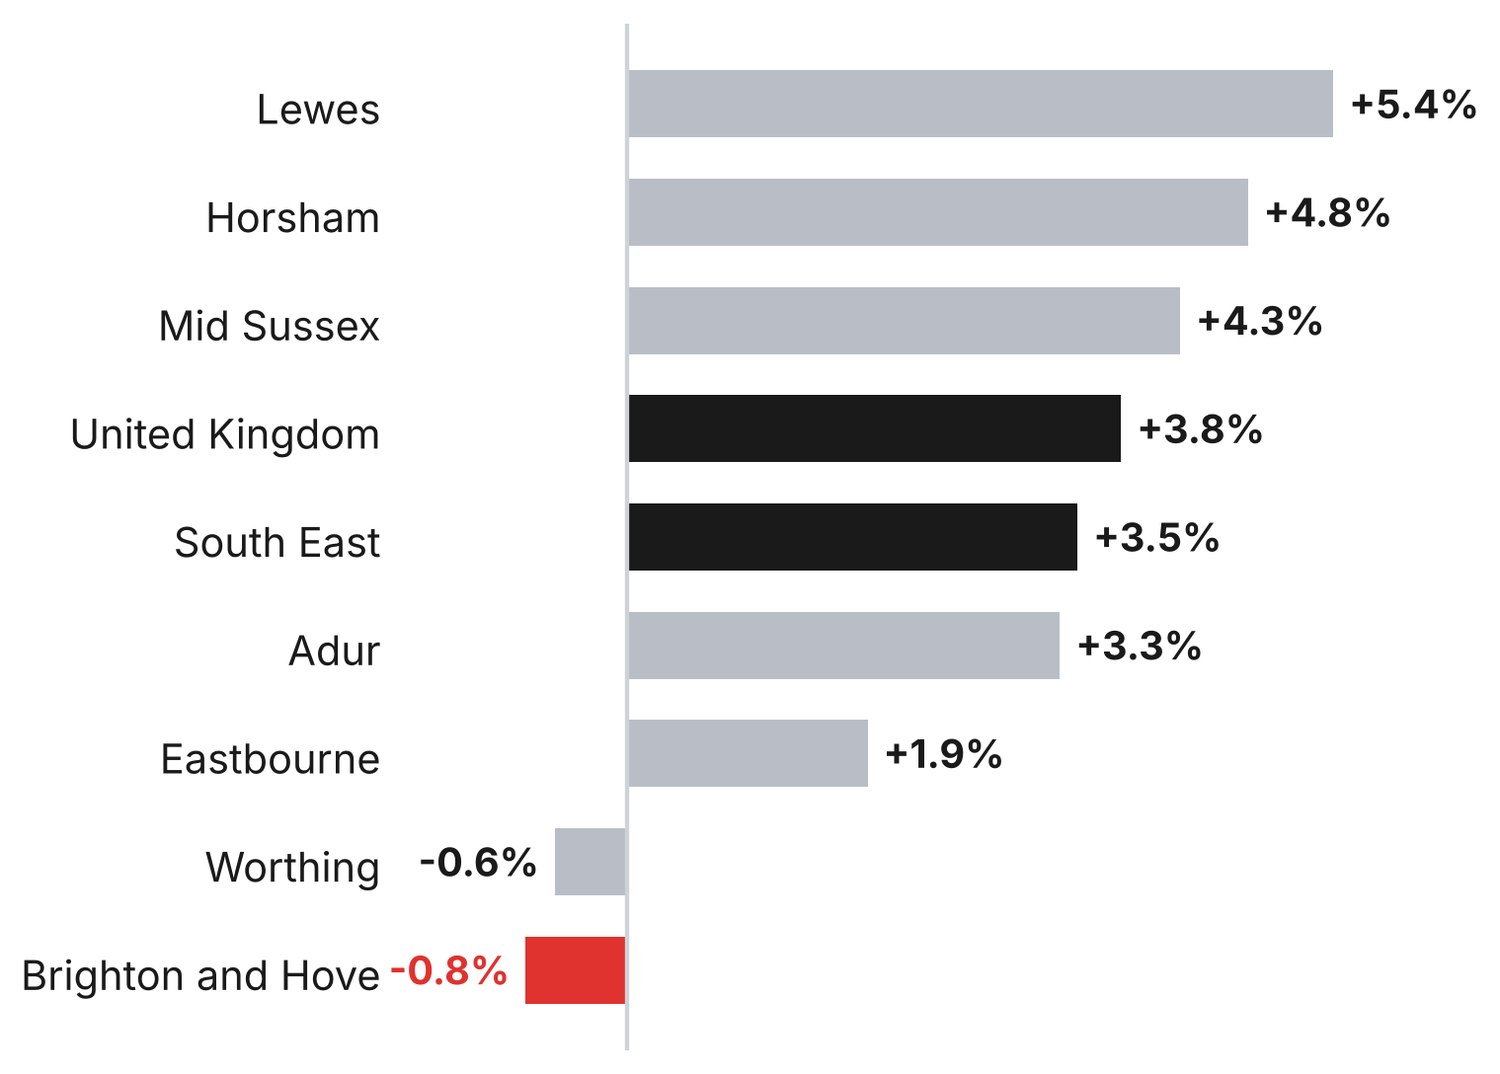
The ONS says the average private rent in the city was £1,816 a month in September, 0.8% lower than a year earlier. Across the UK, average rents rose 3.8% to £1,406. The figures were published on 21 October 2026.
Source: ONS, Private rent and house prices, UK: October 2026 and the ONS Price Index of Private Rents dataset, area code E06000043.
What the ONS figures show
The ONS Price Index of Private Rents measures private rent inflation for new and existing tenancies. In September 2026 the average monthly rent in Brighton and Hove was £1,816, down from £1,830 a year earlier. That is about £168 less over a year.
The city was among 16 of the 334 areas covered where annual rents fell, and had the 10th lowest annual change of all of them. The UK average rose 3.8%, England rose 4.0% and the South East rose 3.5%.
The ONS says its UK rent estimates for the latest two months are provisional and subject to revision.
How the year changed
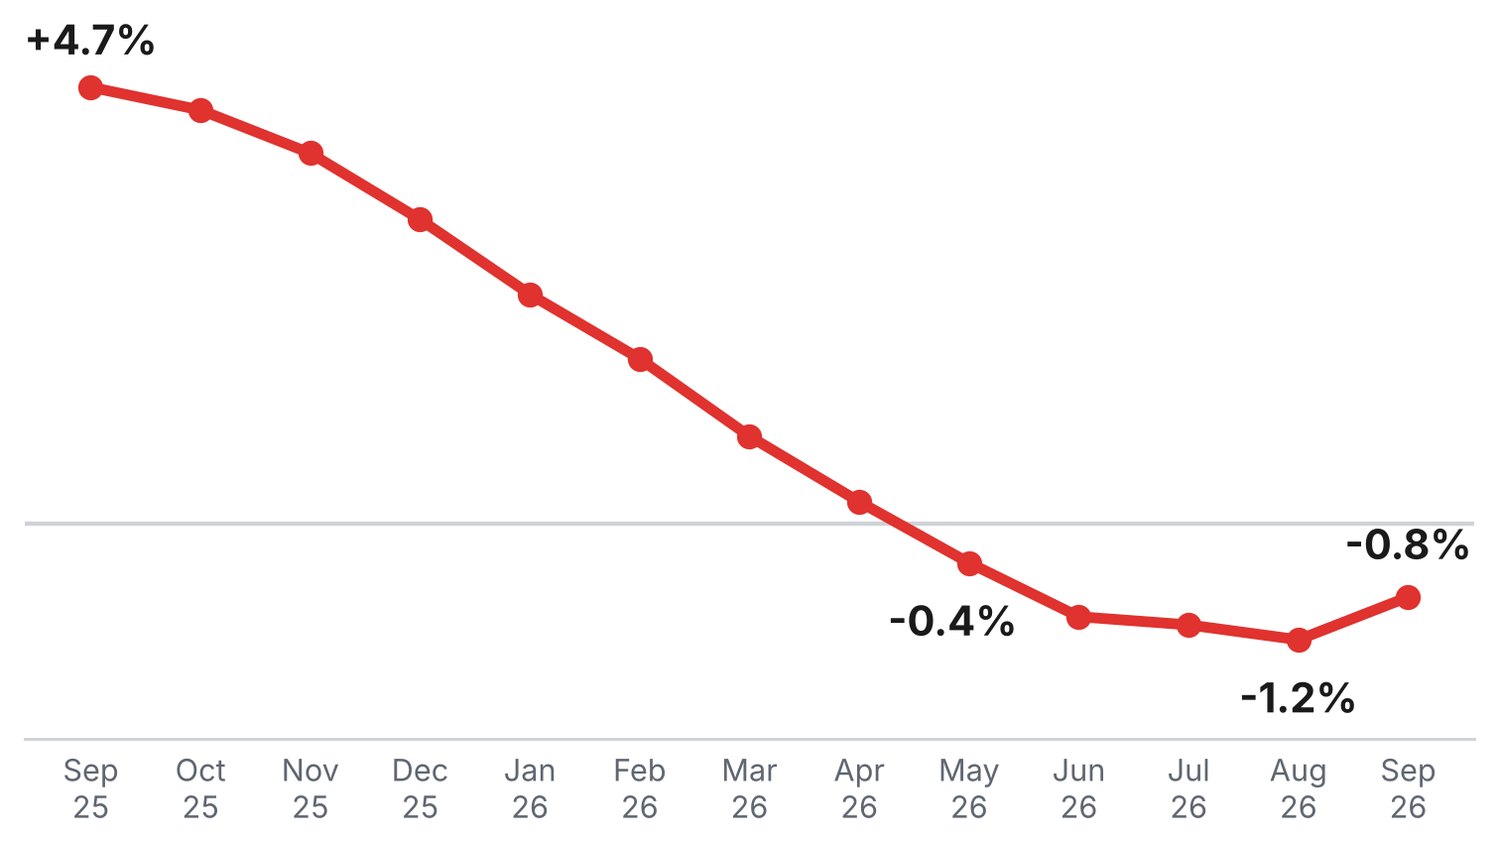
A year ago the picture was very different. In the year to September 2025, rents in Brighton and Hove were rising 4.7%. The annual rate then slowed every month, and went below zero in May 2026, when it reached -0.4%.
It fell furthest in August, to -1.2%, before easing to -0.8% in September. Over that last month the average rent rose 0.5%, from £1,808 to £1,816. The highest average in the ONS series, which starts in 2015, was £1,835 in November 2025.
Five years of rent rises
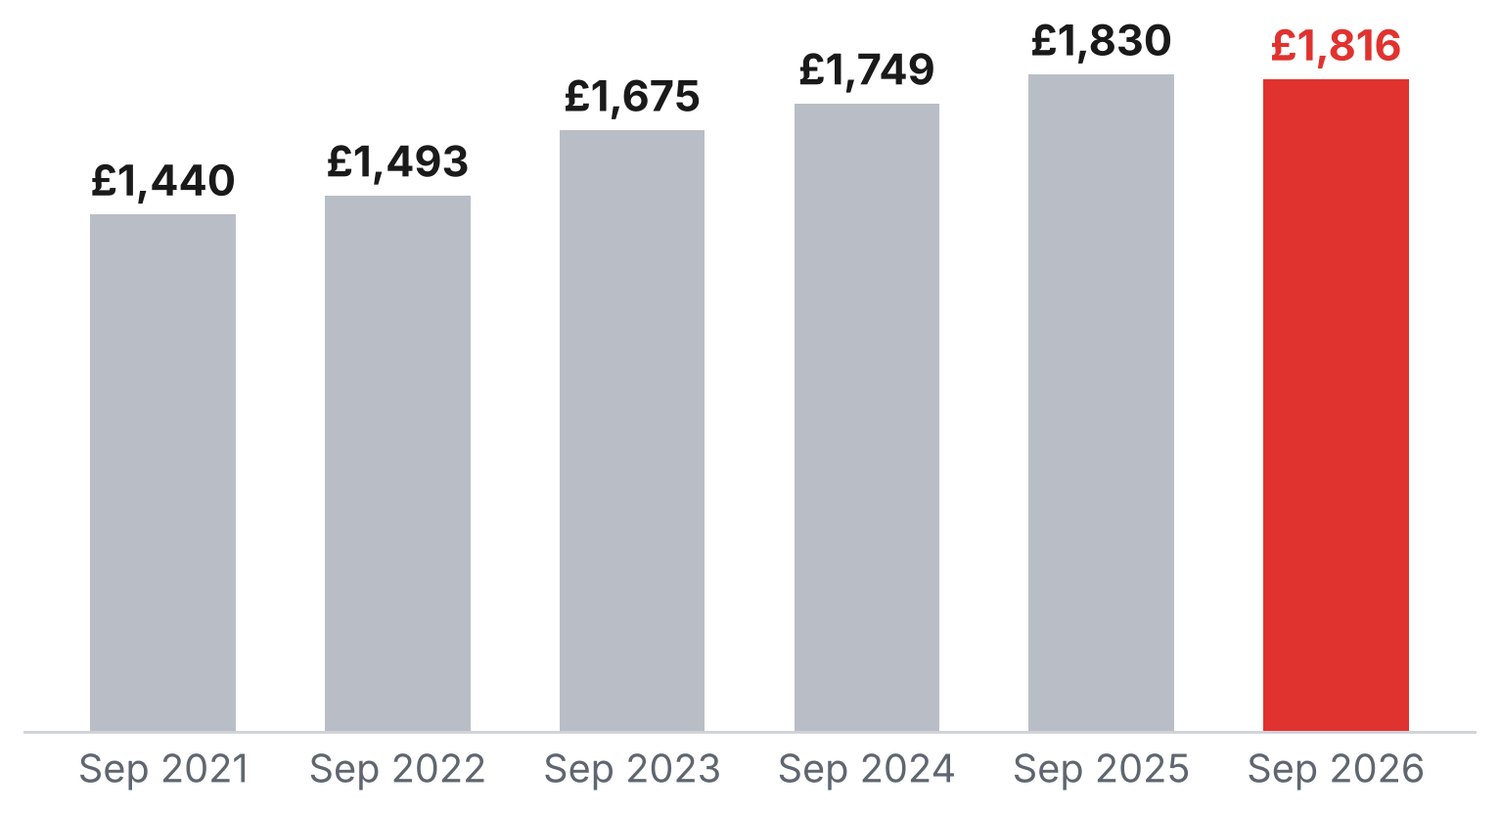
The fall comes after a long climb. In September 2021 the average rent in the city was £1,440. It reached £1,675 in September 2023, a rise of 12.2% in a year, and £1,830 in September 2025.
Even after the latest dip, the average rent is still 26.1% higher than five years ago.
One-bedroom homes
For one-bedroom homes the average rent in Brighton and Hove was £1,194 in September, down 0.5% from £1,201 a year earlier.
Compared with its neighbours
Worthing also saw rents fall, down 0.6% to an average of £1,300. Elsewhere nearby, rents rose: by 5.4% in Lewes, 3.3% in Adur and 1.9% in Eastbourne, according to the same ONS data.
The 16 areas where rents fell
These are the areas where the ONS recorded an annual fall in September 2026, from the biggest drop to the smallest. Brighton and Hove has the third highest average rent of the 16, behind only Westminster and Kingston upon Thames. The Scottish entries are Broad Rental Market Areas, which the ONS says use different data collection from England and Wales.
Sources
More housing stories are under Housing and Brighton and Hove on ImJustBrighton.
Read more from ImJustBrighton
Landlord Licensing Paused in Regency and Central Hove, Challenger Not Named
Brighton Landlords Offered £7,500 Grant for Energy Efficiency and Council Leasing
Brighton & Hove Housing Strategy two-year review: £44m spent, 684 affordable homes delivered



Comments
No comments yet. Start the conversation.